Coordinate Systems
GIS 6005 Communicating GIS
Lab 2
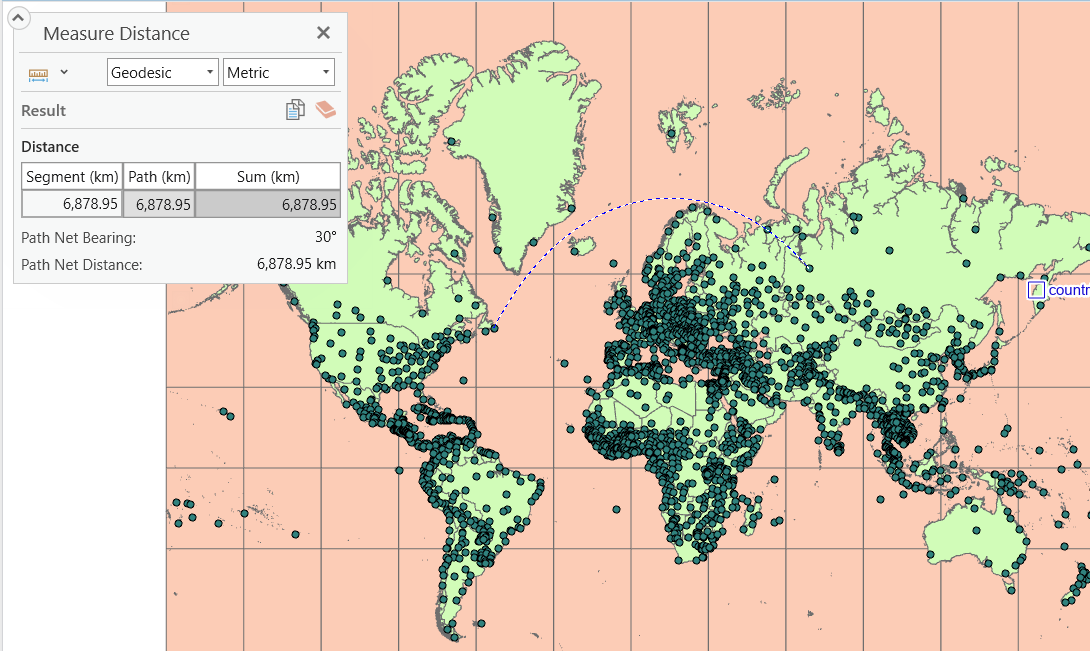
Part 1: Measuring Distances
In this section we explored the measure distance tool and the difference between geodesic and planar measurements. We were also able to observe how distortions vary along with latitude.

Part 2:Comparing Projections
Choosing the correct projection to communicate spatial data is of the utmost importance. In this section we compare the properties of different projections.
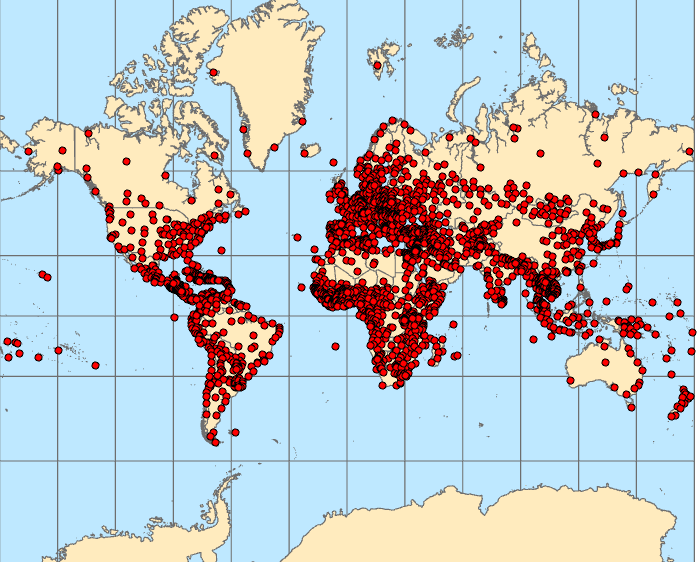
Mercator (World) Characteristics:
Cylindrical projection
Conformal
Tangent Case
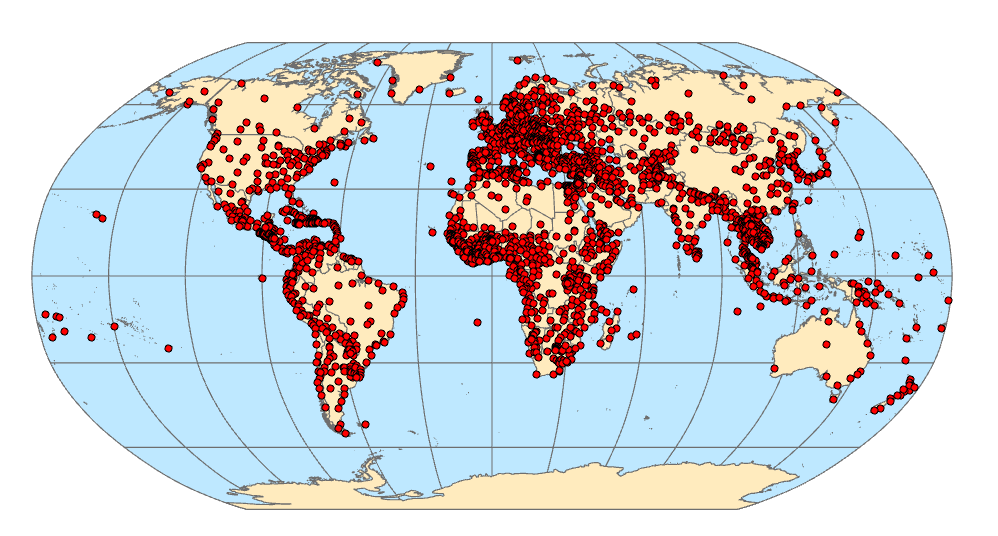
Robinson (World) Projection Characteristics:
pseudocylindrical compromise
Neither equal area nor conformal
Designed to be visually appealing
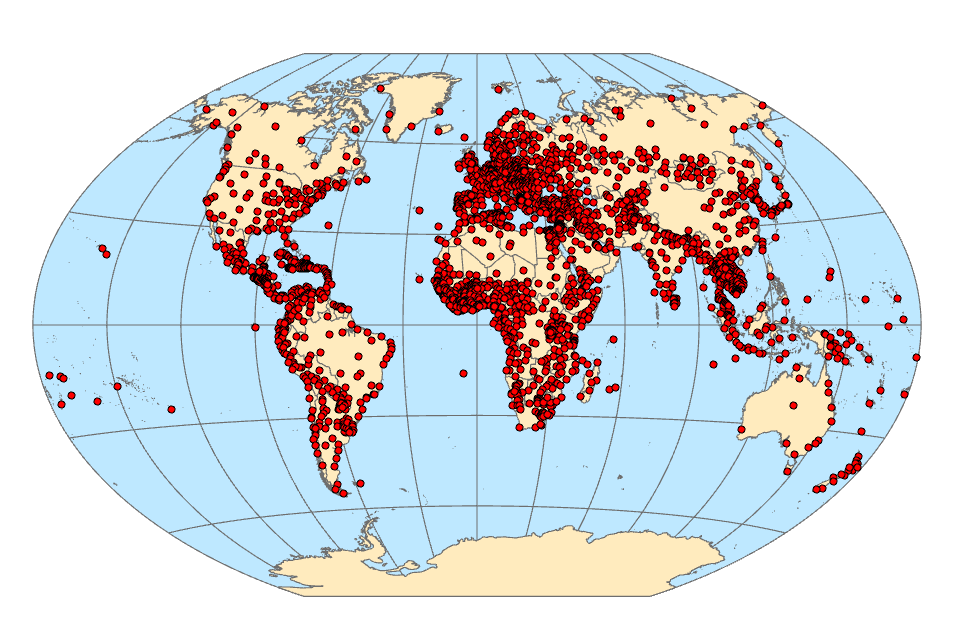
Winkel Tripel Projection (Below) Characteristics:
Pseudocylindrical compromise
Neither equal area nor conformal
Designed to be visually appealing
Convenient aspect ratio for on screen display
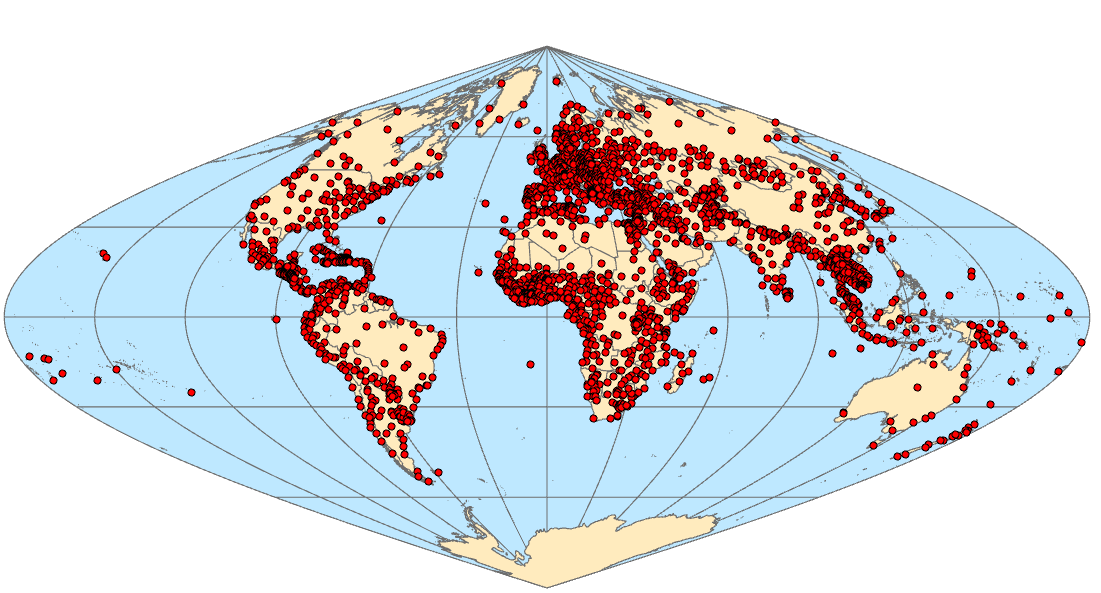
Sinusoidal Projection (Below) Characteristics:
Equal area
Uniquely pointed poles
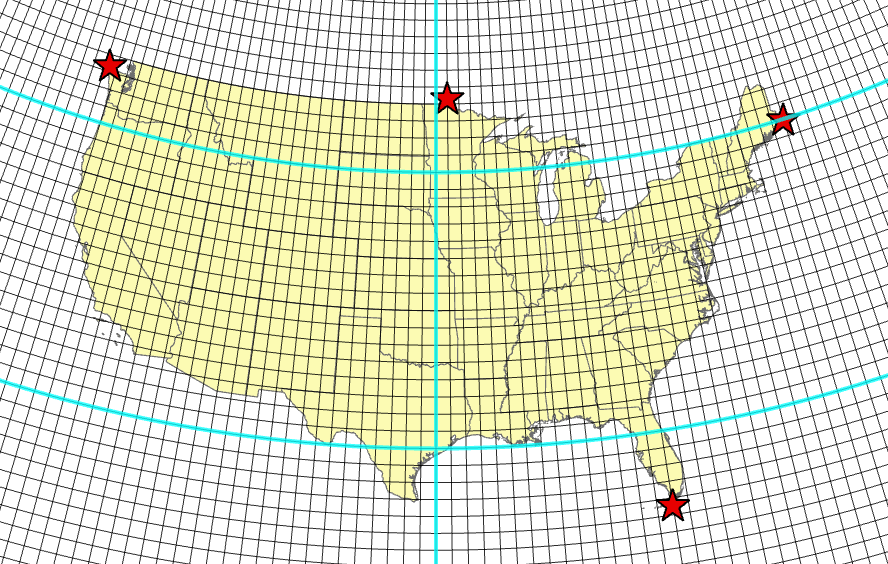
Part 3: Conic Projections
Here are the general rules for setting the parameters of conic projections:
The central meridian should run through the middle of the region of interest
The reference latitude should be placed wherever you think the center of a coordinate system should be (usually either at the center or below the bottom of the extent of the geographic features).
As a general rule, the two standard parallels should be located approximately 1/6 from the bottom and 1/6 from the top of the geographic extent of the mapped features. This is known as the “One-Sixth Rule” for conic projections.
In this section, we are asked to evaluate whether or not this projection is well-balanced and appropriate for the study area.
After determining the central meridian, standard parallel 1&2, I defined the most northern, eastern, southern, and western points in the study area. I was able to calculate where the most ideal locations for the central meridian and standard parallels are and compare them with the previous numbers. In this case, this is an appropriate projection for the study area.
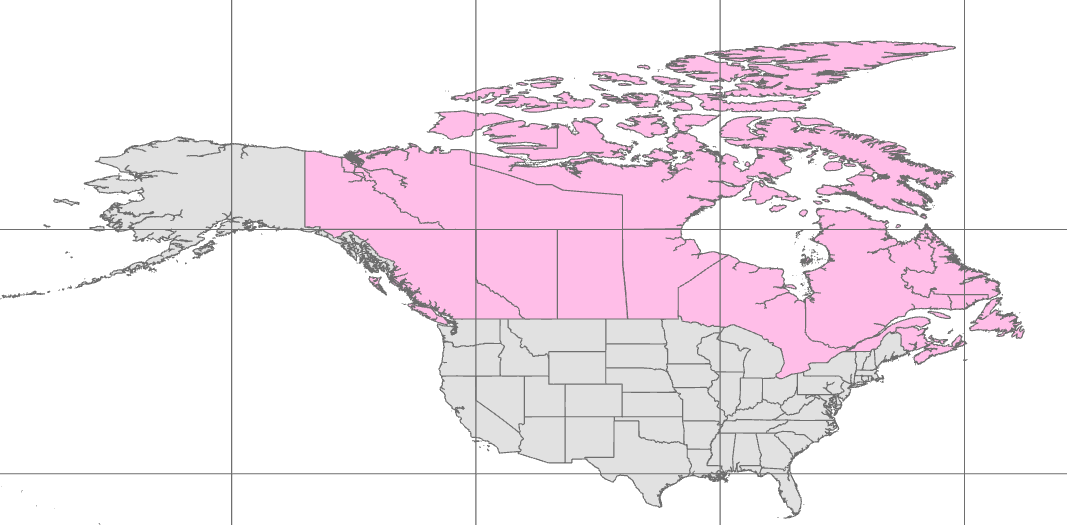
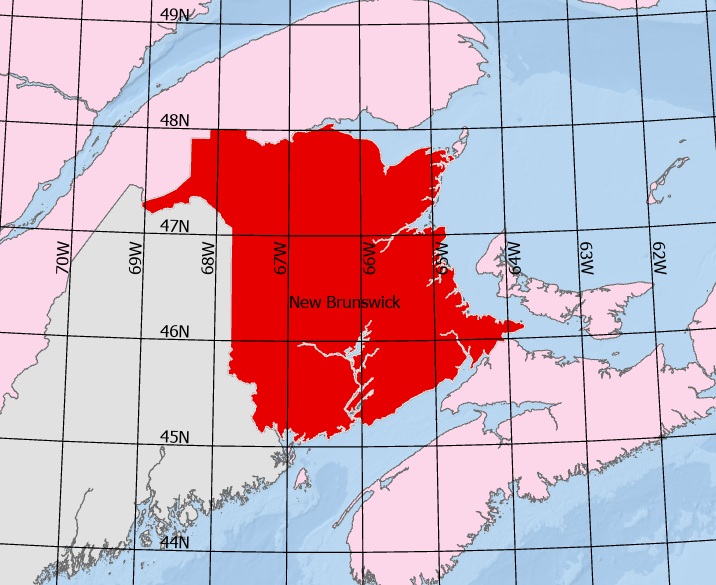
Part 4: Coordinate Systems for Canada
Perhaps the easiest way to understand the importance of choosing a projected coordinate system is to compare different coordinate systems to one another. Look at how the map below changes when it is projected to a different coordinate system. Each grid cell represents 30 degrees by 30 degrees.
WGS 1984:
Lambert Conformal Conic Projection:
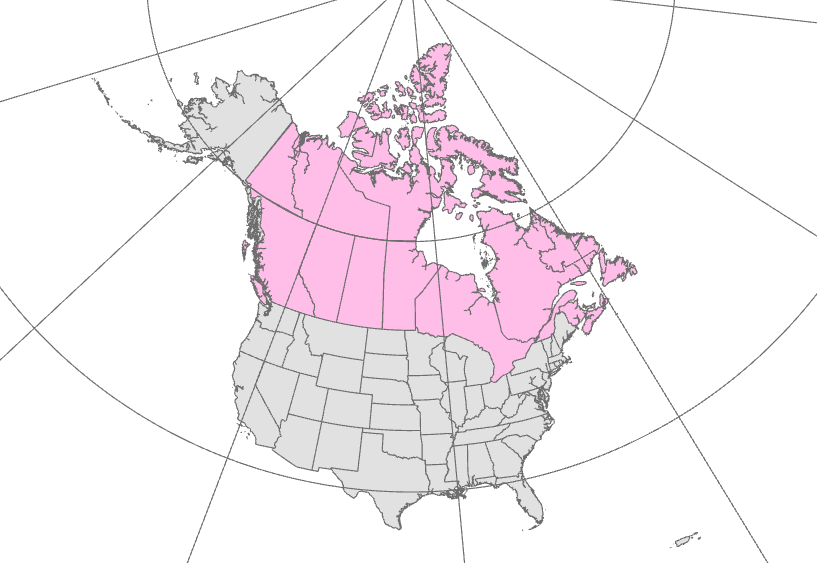
We were tasked with choosing an area of interest in Canada and selecting an appropriate projection. I chose New Brunswick as my area and selected a projection focused on that area. I selected an azimuthal projection because this area is in a large area and in a polar region
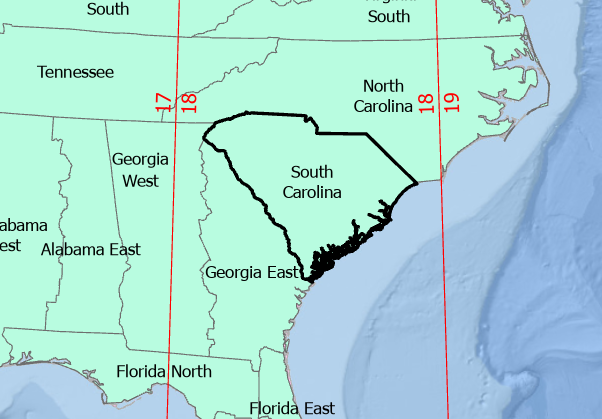
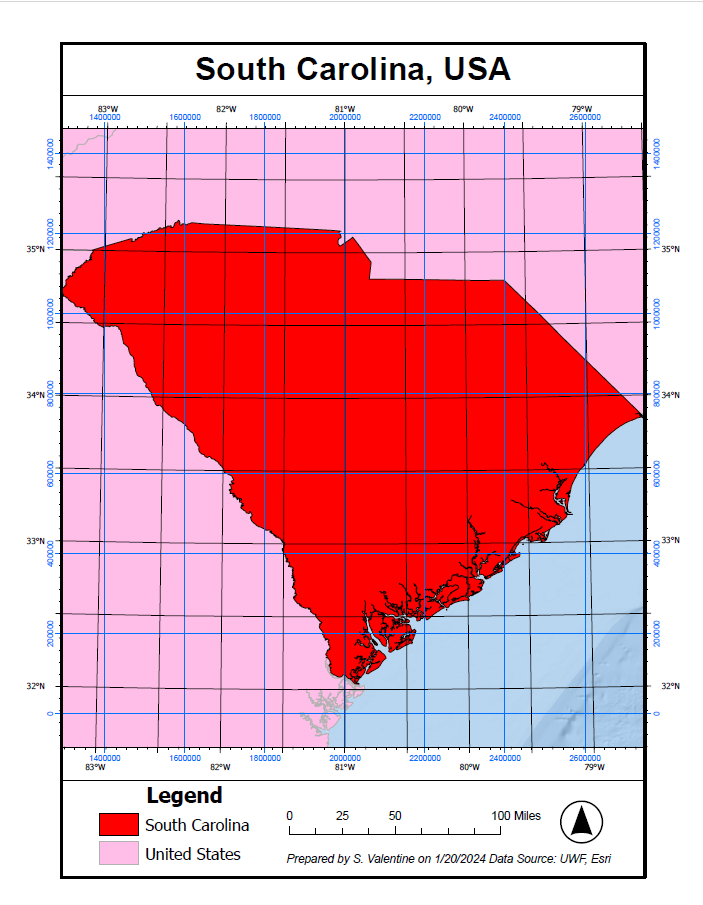
Part 5:US States
As in the last part we are tasked with choosing an appropriate projection. I chose a conic projection because my chosen state (South Carolina) is in the mid-latitudes. I chose a state plane coordinate system because it is the most accurate. This state only has one state plane zone and falls within one UTM zone, so either could have been used.
Projection Selected: NAD 1983 StatePlane South Carolina FIPS 3900 (US Feet)
Using this information I created this finished map:
References
Double stereographic—ArcGIS Pro | Documentation. (n.d.). ArcGIS Pro Resources | Tutorials, Documentation, Videos & More. Retrieved January 20, 2024, from https://pro.arcgis.com/en/pro-app/3.1/help/mapping/properties/double-stereographic.htm
Jung, T. (n.d.). Compare Map Projections. Compare Map Projections. Retrieved January 15, 2024, from https://map-projections.net/index.php
Kimerling, A. J., Buckley, A. R., Muehrcke, P. C., & Muehrcke, J. O. (2016). Map Use: Reading, Analysis, Interpretation. Esri Press.
Wikipedia contributors. (2023, December 14). Tissot's indicatrix. Wikipedia. Retrieved January 15, 2024, from https://en.wikipedia.org/wiki/Tissot%27s_indicatrix
Comments
Post a Comment