Suitability Analysis
GIS 5100 Applications in GIS- Module 6
Student Learning Objectives:
- Perform suitability analysis using both vector and raster analysis tools
- Prepare data for use in suitability analysis
- Compare different approaches to suitability analysis, including Boolean and scoring
- Compare vector and raster tools to complete specific steps in suitability analysis
- Adjust specific parameters employed in suitability analysis, such as scoring and weighting
Scenario 1:
You are part of a conservation group in Oregon that received a grant to put tracking collars on mountain lions (or cougars) in an effort to make the study area a conservation area and protect it from housing developments and pipelines. The group has asked you to use GIS to identify the habitat where they would be most likely to encounter mountain lions to collar. During your research, you discover the 2017 Oregon Cougar Management Plan and the following line about habitat “Forested areas, canyons, or rugged mountainous terrain, and areas with high prey populations are preferred...” You also decide that habitat should be close to a water source, but far from roads. You decide on the following criteria for your Analysis:
- More than 2,500 feet from highways (light green)
- Within 2,500 feet of a river (transparent blue)
- Slopes greater than 9 degrees (lime green)
- Covered by forest (purple)
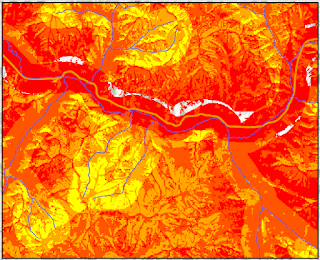
The red areas represent the areas that meet all 4 of the above criteria. The blue lines represent rivers and the orange line represents the highway.
Analysis A: Boolean Suitability in Vectors

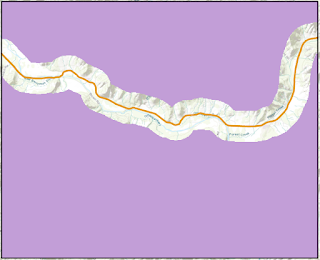
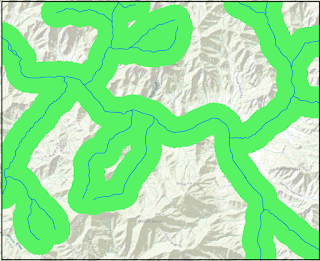
Above: Rivers (blue) and Highway (orange) shape files are used to determine which areas are located within 2500 ft of a river and 2500ft away from the highway:

Above: areas that are 2500ft from a highway. This layer was created by using the buffer tool and then using the resulting feature class as the input for the erase tool. The results in geometry that selects everywhere within the study area that is beyond 2500ft away from the highway.
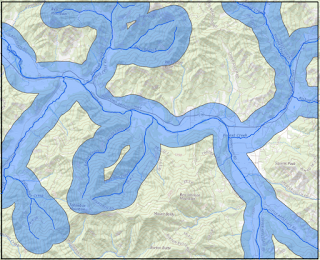
Above: Areas that are within 2500 ft of a river. This is accomplished using the buffer tool.

Above: Areas with the required landcover. We were provided with landcover information and used the reclassify tool to select only the appropriate landcover types. After converting these to polygons, these were then selected and used to create a new feature class.

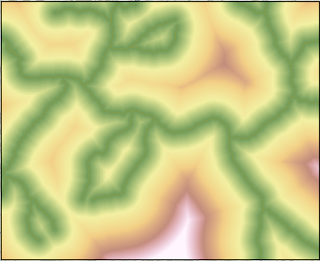
Above: Areas with a slope greater than 9%. This layer was created by using the slope tool on a DEM and then reclassifying the result as either within that slope range (=1) or below that slope range (=0). After converting this layer to a polygon select by attributes is used to create a new layer that only represents areas with suitable slope.
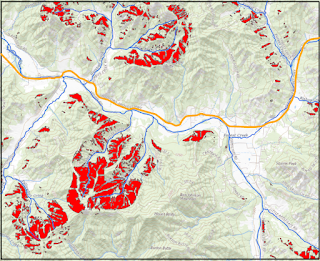
Above: The areas that meet all 4 criteria. The previously described layers are combined and then select by attributes is used to determine which areas meet all 4 criteria.
Analysis B: Boolean Suitability in Raster
This is another way to accomplish a similar result as the previous analysis. Instead of using vectors this analysis takes advantage of rasters.

Above: The highway feature class is used as the input for the Euclidian distance tool. The distances are then reclassified into two categories: within 2500 ft of the highway (=0) or further away than 2500ft(=1). The result is shown below.
Like with the highway feature class, the rivers feature class is used as the input for the Euclidian distance tool. The distances are then reclassified into two categories: within 2500 ft of the highway (=1) or further away than 2500ft(=0). Result shown below.
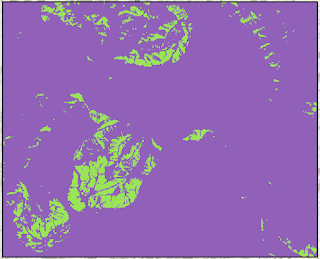
These can then be combined with the slope and landcover areas that were created for the first analysis to produce a similar result as the first analysis (below, green represents areas that meet all criteria and purple represents the areas that do not. )
However additional analysis can be done to create a scale of suitability This can be done using raster calculator to determine which areas meet one or more criteria.
Analysis C: Rating Locations in Raster

Comments
Post a Comment