ArcGIS Field Maps and Projection Labs
Module 3
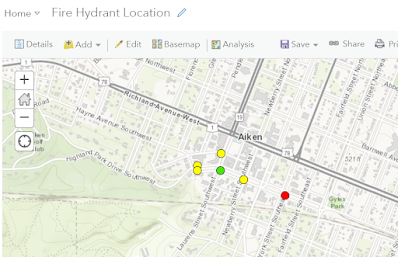
ArcGIS Field Maps Lab
In the first lab we grabbed our hats and headed out to collect some data of our own. We learned how to set up domains to facilitate this data collection. Afterward, we learned several different ways that we could share our data- web map, KML, and Map Package. We compared and contrasted the benefits and drawbacks of each method. Accessing the map via ArcGIS online was my favorite method because of the access to photos that the other two methods did not have.
Projections Lab:
In this lab we delved into the data behind maps. As I worked through the lab it became immediately obvious that when delving into the coordinate systems we as GIS scientists need to carefully consider which system we choose as it will have a direct impact on our data and the information we are attempting to communicate and display. This is the “foundation” of the map. I find this interesting because it's invisible unless compared to a different coordinate system like in the map below. Consistency is crucial to having relative and useful data. When comparing data from multiple datasets, it is important to make sure that the coordinate system that is used works well and is the same for all datasets being used because the relationship between the data can be easily distorted otherwise. Many things can cause the variation between the county areas above. A couple of examples might include how the coordinate system is designed: is it designed to preserve shape or area?
.png)
I feel like I learned a lot in these two labs. I especially enjoyed setting up a way to collect data in the field and collecting data with the tool I set up.
Comments
Post a Comment